Exploring Data: Types and Trends

Data science is like being a detective in the world of information. It's all about digging into data, whether it's neatly organized or a bit messy, to uncover valuable insights and solve problems.

Imagine you have a huge pile of puzzle pieces. Some are already put together neatly, while others are scattered all over the place. Data scientists are like puzzle solvers. They take these pieces (data) and try to fit them together to see the bigger picture.
Sometimes, the data is already organized neatly, like a puzzle with most of its pieces in place. This is called structured data. Other times, the data is more like a jumble of pieces waiting to be sorted out. This is called raw or unstructured data.
Regardless of its form, data science involves experimenting with data. It's about asking questions, testing hypotheses, and uncovering patterns that can help businesses make better decisions. Whether it's analyzing sales trends, predicting customer behavior, or understanding market dynamics, data science is the key to unlocking valuable insights from the vast sea of information.
So, in this blog post, we will give you a view of the basic types of data.
Types of Data

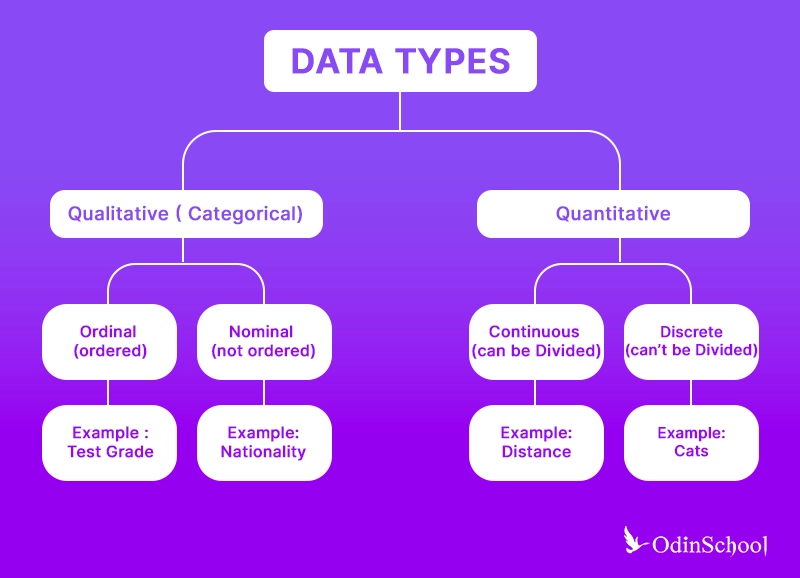
What is the difference between qualitative and quantitative data?
Below are the key differences between qualitative and quantitative data.
| Aspect | Qualitative Data | Quantitative Data |
|---|---|---|
| Nature | Descriptive, non-numeric | Numerical, measurable |
| Measurement | Based on qualities, attributes, or characteristics | Based on quantities, amounts, or numerical values |
| Examples | Interview transcripts, observations, and opinions | Sales figures, heights, temperatures, and test scores |
| Analysis | Interpretation, thematic analysis, and coding | Statistical analysis, calculations, and numerical modeling |
| Purpose | Understanding meanings, exploring perceptions | Making comparisons, measuring relationships |
| Representation | Words, images, and narratives | Numbers, graphs, charts, percentages |
| Flexibility | Subjective, open to interpretation | Objective, less subject to interpretation |
In simple terms,
Qualitative data is like describing a story with words and pictures. It's about the qualities and characteristics of things, not how many or how much. So, instead of numbers, you're talking about what you see, hear, or feel. For example, if you're describing a flower, you might talk about its color, smell, or shape. It's all about the details and the story behind them!
and,
Quantitative data is all about numbers and measurements. It's like counting and measuring things to get a clear picture. Instead of descriptions or stories, you're dealing with facts and figures. For example, if you're talking about the number of apples in a basket or the temperature outside, that's quantitative data. It's precise and helps you make comparisons or calculations.

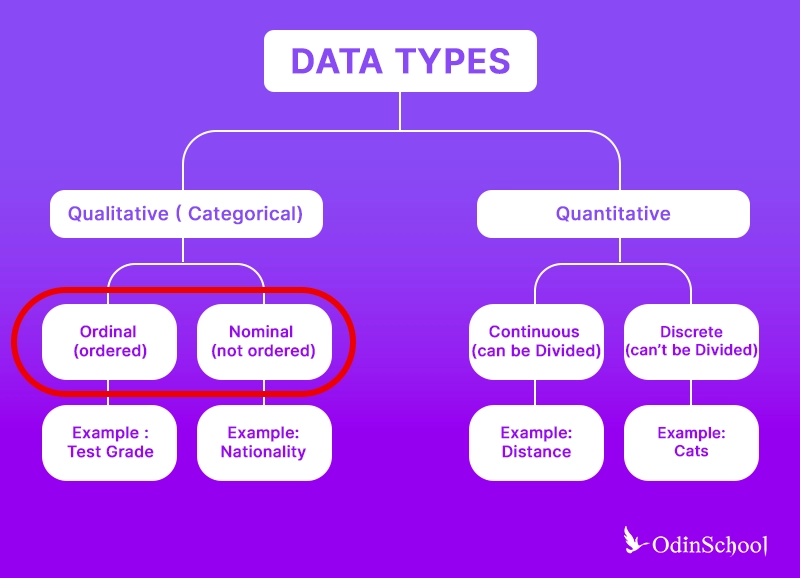
What is the difference between Nominal data and Ordinal data?
Below are the key differences between normal data and ordinal data in terms of their definition, examples, suitability for arithmetic operations, order, and representation.
| Aspect | Nominal Data | Ordinal Data |
|---|---|---|
| Definition | Consist of categories or labels with no inherent order | Represents values with a natural order or ranking |
| Examples | Colors (red, blue, green), genders (male, female) | Rankings (first, second, third), Likert scale |
| Quantifiability | Qualitative, cannot be quantified numerically | Qualitative or quantitative, ordinal ranking |
| Arithmetic Ops | Not applicable | Not applicable for all operations |
| Representation | Categories or labels | Ordered categories or ranks |
In simple terms,
Nominal data is like putting things into groups or categories. It's about labels without any specific order or ranking. So, if you're talking about colors, genders, or types of fruit, that's nominal data. It's like sorting things into different boxes based on their characteristics or labels, but the order of the boxes doesn't matter.
and,
Ordinal data is a bit like organizing things in order, but not necessarily counting them. It's about putting things in a sequence or ranking based on some criteria. For example, if you're talking about sizes like small, medium, and large, or if you're ranking preferences as first, second, and third, that's ordinal data. It's like arranging things from least to greatest or ranking them based on importance, but you're not necessarily measuring exact amounts.

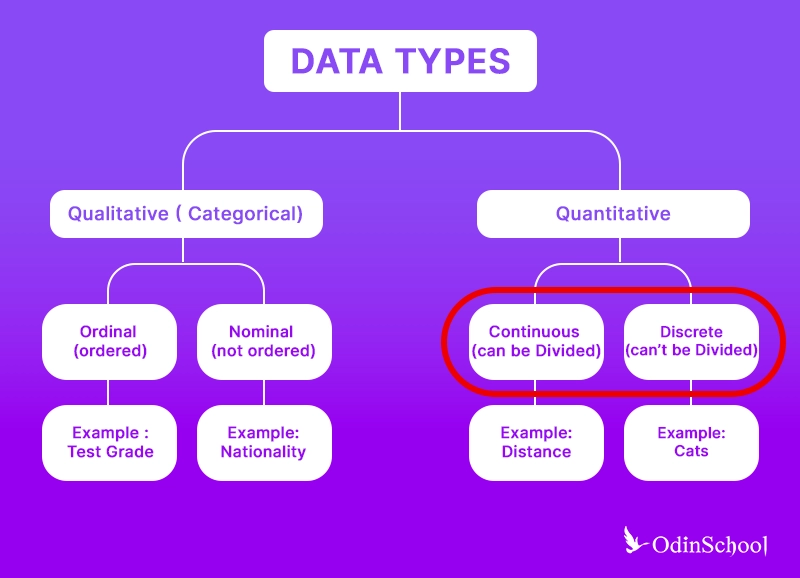
What is the difference between discrete data and continuous data?
Below are the key differences between discrete data and continuous data in terms of their definition, examples, suitability for arithmetic operations, order, and representation.
| Aspect | Discrete Data | Continuous Data |
|---|---|---|
| Definition | Consists of separate, distinct values | Represents an unbroken range of values |
| Examples | Counts, integers, and whole numbers | Measurements, decimals, and fractions |
| Nature | Typically, whole numbers or integers | Can take on any value within a range |
| Measurement Scale | Typically measured on a countable scale | Measured on a continuous scale, often with decimals |
| Representation | Often represented by bar charts or histograms | Represented by line graphs or density plots |
| Example Application | Number of students in a class, number of cars in a lot | Height, weight, temperature, and time elapsed |
In simple terms,
Discrete data is like counting things you can see or touch, but you can't have "in-between" values. It's all about distinct, separate numbers—no fractions or decimals allowed. For example, if you're counting how many apples are in a basket, you'd count 1, 2, 3, and so on, but you can't have 1.5 apples.
and,
Continuous data is like measuring something that can be any value along a scale, even fractions or decimals. Imagine you're measuring the length of a rope; it could be 1 meter, 1.5 meters, 1.75 meters, and so on. There's no limit to how precise your measurements can be.

Emerging Trends in Data Types
Emerging trends in data types revolve around advancements in data science, analytics, and machine learning, addressing the increasingly complex and voluminous data that modern technologies generate.
Here are the top key trends:
Trend 1 - Structured Data in New Formats
Beyond traditional databases, new formats and standards for structured data are emerging to handle more complex interactions and faster processing, such as time-series databases for IoT data or blockchain databases for secure transaction recording.
Trend 2 - Unstructured Data Utilization
There's a growing emphasis on harnessing unstructured data (like images, videos, text, and audio). Technologies such as natural language processing and computer vision are advancing to make sense of this data more effectively and efficiently.
Trend 3 - Real-time Data Streams
The use of real-time data streaming technologies is increasing. These allow for the immediate processing of data as it's generated, which is crucial for applications in finance, health monitoring, and real-time analytics.
Trend 4 - Synthetic Data
As privacy concerns and data accessibility continue to be challenges, synthetic data generation is a trend gaining traction. This involves creating artificial datasets that mimic real-world data's statistical properties without compromising individual privacy.
Trend 5 - Augmented Data Management
This refers to the use of machine learning and AI to improve data quality, enhance metadata management, and simplify data access and sharing. It helps businesses gain better insights and make more informed decisions.
Trend 6 - Semantic Data Types
There is an increasing focus on semantic data types that not only define the structure of data but also understand the meaning and context. This is particularly useful in complex fields like healthcare and legal industries.
Trend 7 - Edge Data Management
With the growth of edge computing, managing data at the edge of networks (close to where data is generated) is becoming a trend. This involves processing data locally on devices like smartphones or IoT devices, reducing latency and bandwidth use.
Trend 8 - Quantum Data Types
Quantum computing introduces new data types that leverage quantum bits (qubits). While still in early stages, they promise exponentially faster processing for particular types of problems.
Conclusion
In conclusion, data science serves as the investigative tool of the digital age, enabling us to unravel insights from the vast sea of information. By understanding the fundamental types of data, we gain the necessary toolkit to navigate the complexities of data analysis.
Moreover, staying abreast of emerging trends in data science ensures that we remain agile and adaptable in harnessing the power of data to drive informed decision-making and innovation
Additionally, considering the intricate nature of data science, it's paramount to consider enrolling in a dedicated data science course. These courses offer structured learning modules, hands-on experience with cutting-edge tools and techniques, and invaluable guidance from seasoned professionals. Whether you're venturing into data science for the first time or aiming to deepen your expertise, a data science course can provide the necessary foundation and skills to excel in this rapidly evolving field.
{% module_block module "widget_d91deb01-35dc-499d-bb42-10274aa5d29f" %}{% module_attribute "alignment" is_json="true" %}{% raw %}"text-center"{% endraw %}{% end_module_attribute %}{% module_attribute "button_style" is_json="true" %}{% raw %}"button fs-5 fw-semibold py-3 shadow"{% endraw %}{% end_module_attribute %}{% module_attribute "button_text" is_json="true" %}{% raw %}"Success Stories"{% endraw %}{% end_module_attribute %}{% module_attribute "child_css" is_json="true" %}{% raw %}{}{% endraw %}{% end_module_attribute %}{% module_attribute "css" is_json="true" %}{% raw %}{}{% endraw %}{% end_module_attribute %}{% module_attribute "definition_id" is_json="true" %}{% raw %}null{% endraw %}{% end_module_attribute %}{% module_attribute "field_types" is_json="true" %}{% raw %}{"Spacing":"group","alignment":"choice","button_style":"choice","button_text":"text","link":"text","smoothscroll":"boolean"}{% endraw %}{% end_module_attribute %}{% module_attribute "label" is_json="true" %}{% raw %}null{% endraw %}{% end_module_attribute %}{% module_attribute "link" is_json="true" %}{% raw %}"https://www.odinschool.com/success-stories"{% endraw %}{% end_module_attribute %}{% module_attribute "module_id" is_json="true" %}{% raw %}113008019537{% endraw %}{% end_module_attribute %}{% module_attribute "path" is_json="true" %}{% raw %}"/OdinSchool_V3/modules/Link Button"{% endraw %}{% end_module_attribute %}{% module_attribute "schema_version" is_json="true" %}{% raw %}2{% endraw %}{% end_module_attribute %}{% module_attribute "smart_objects" is_json="true" %}{% raw %}null{% endraw %}{% end_module_attribute %}{% module_attribute "smart_type" is_json="true" %}{% raw %}"NOT_SMART"{% endraw %}{% end_module_attribute %}{% module_attribute "tag" is_json="true" %}{% raw %}"module"{% endraw %}{% end_module_attribute %}{% module_attribute "type" is_json="true" %}{% raw %}"module"{% endraw %}{% end_module_attribute %}{% module_attribute "wrap_field_tag" is_json="true" %}{% raw %}"div"{% endraw %}{% end_module_attribute %}{% end_module_block %}
Frequently Asked Questions
Q: Are these the only data types—nominal, discrete, ordinal, and continuous?
These are are commonly discussed data types. There are other data types, like, Interval data, Ratio data, Categorical data, Binary data, Time-series data, Geospatial data, and Textual data.
Q: Why do we have to know about the data types?
Knowing about data types is essential for choosing appropriate analytical techniques, visualizations, and data preprocessing methods. Understanding data types enables effective communication of insights and supports informed decision-making.
Q: Are data types different from data structures?
Yes, data types and data structures are different concepts. Data types define the type of data that can be stored in a variable or used in a programming language. Examples include integers, floating-point numbers, characters, and strings. And, data structures organize and store data in a computer to facilitate efficient access and manipulation. Examples include arrays, linked lists, stacks, and queues.