Top 15 'Must-Know' Data Science Tools: A Comprehensive Guide

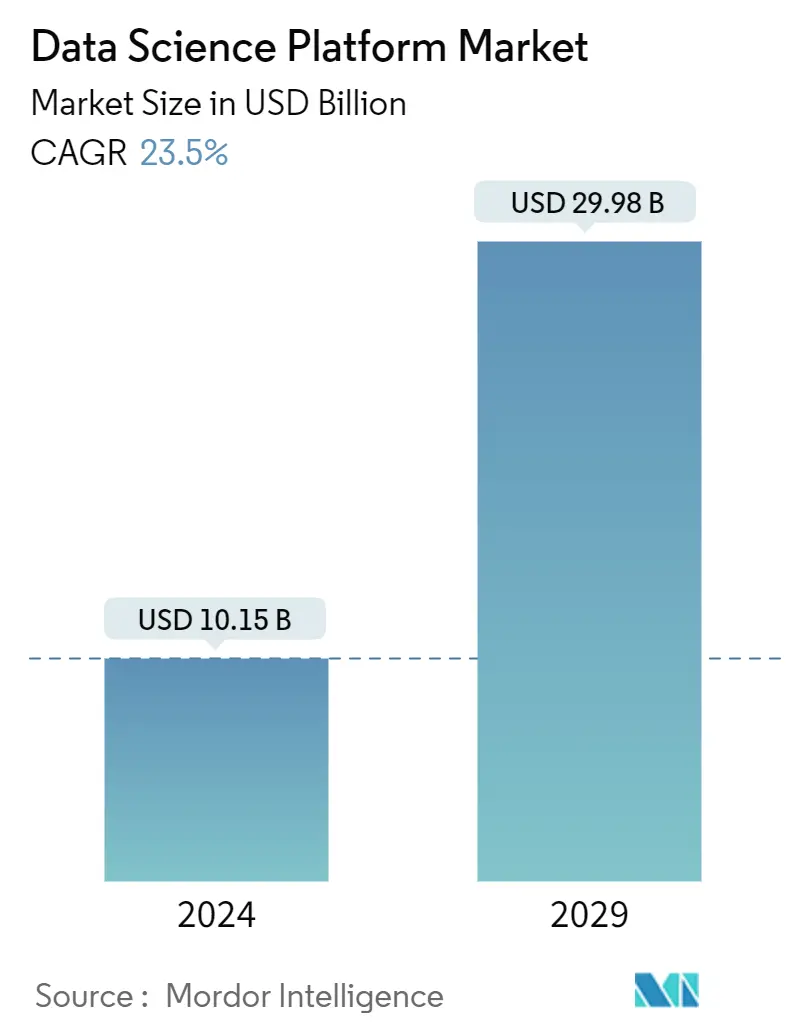
Businesses are placing more emphasis on enhancing their internal data science resources in order to develop machine learning models and close the skills gap in hiring, which will lead to a rise in the use of data science as a service (DSaaS).
OdinSchool Thoughts - Top Data Science Trends and Challenges for 2024
Due to the rapid advancement of technologies like artificial intelligence (AI) and machine learning (ML), organizations are acquiring a notably greater volume of data, including new data that is derived from previously existing datasets as well as entirely new types of data.
Data Science and Artificial Intelligence: Partners in Tech Innovation
As a result, companies are adopting data science solutions that meet their needs in order to leverage this data.
Primary Obstacle to Utilize Data Science
The main challenge brought about by a shortage of skilled employees is the incapacity to extract valuable insights from the enormous amounts of data that companies produce.
Although complicated datasets can be analyzed and interpreted by users using data science platforms, these platforms are less effective due to a lack of qualified personnel to oversee them. Businesses find it difficult to close the knowledge gap between the sophisticated features of data science platforms and the skills required to fully utilize them.
Businesses in a variety of industries use data science to help them make informed decisions. Additionally, the acceptance of data science was accelerated by the move to remote work, which allowed data scientists to interact efficiently from any location. The demand for data science talent was further spurred by this flexibility and accessibility.
Why is There a Constant Need for Data Science?
Top 15 'Must-Know' Data Science Tools: A Comprehensive Guide
From data collection and cleaning to modeling and visualization, there's a plethora of tools available to streamline every stage of the data science workflow. Hence, in this blog, we have curated a list of data science tools that are like 'must-know' tools for anyone looking to upskill in data science.
General-purpose tools
MS Excel

Microsoft Excel is a versatile spreadsheet software used for data analysis, visualization, and management. With features for calculation, graphing tools, and pivot tables, Excel facilitates tasks ranging from budgeting and financial analysis to project management. Its widespread availability and user-friendly interface make it a staple tool in various industries.
Five Excellent Basic Formatting Tips On MS Excel
-
Data Cleaning: Utilize Excel's sorting, filtering, and duplicate removal functions to streamline the process of cleaning and preparing datasets for analysis.
-
Pivot Tables: Create pivot tables in Excel to swiftly analyze and summarize large datasets by dragging and dropping fields, providing insights into trends and patterns.
-
Charting Tools: Visualize data effectively by selecting the data range and choosing from Excel's various chart types, enhancing data exploration and presentation.
-
Data Manipulation: Apply Excel functions like VLOOKUP and IF statements to manipulate and analyze data easily, facilitating efficient preprocessing tasks.
-
Collaboration: Share Excel workbooks with team members via cloud storage or network drives, enabling simultaneous collaboration and real-time updates on data analysis tasks.
-
Automation: Record macros in Excel to automate repetitive tasks by recording a series of actions and playing them back with a single click, saving time in data processing workflows.
-
Reporting: Format Excel spreadsheets using features like cell formatting and conditional formatting to create visually appealing reports, communicating findings and insights effectively.
-
Data Validation: Set up data validation rules in Excel to restrict the type and format of data entered into cells, ensuring data accuracy and integrity.
-
What-if Analysis: Perform what-if analysis in Excel by using scenarios and data tables to explore different possibilities and assess their impact on outcomes, aiding decision-making processes.
-
Modeling: Use Excel's built-in functions and tools for basic statistical analysis and forecasting, allowing for the creation of simple models to analyze data and predict future trends.
Unlocking Success: AON Analyst's Middle-Class Climb to a 124% Salary Hike!
Programming Language-driven Tools
Python
![]()
Python is a versatile programming language widely used in data science for its simplicity and powerful libraries. With libraries like Pandas for data manipulation and NumPy for numerical computing, Python enables efficient data analysis. Additionally, its extensive ecosystem includes libraries like TensorFlow and scikit-learn for machine learning tasks.
-
Data Analysis: Python offers powerful libraries like Pandas and NumPy for efficient data manipulation, exploration, and analysis, making it a preferred choice for data scientists.
-
Machine Learning: Python's extensive ecosystem includes libraries like scikit-learn and TensorFlow, enabling the implementation of various machine learning algorithms for tasks such as classification, regression, and clustering.
-
Web Development: With frameworks like Django and Flask, Python facilitates web development, allowing for the creation of dynamic and scalable web applications.
-
Automation: Python's simplicity and readability make it ideal for automating repetitive tasks, ranging from file manipulation to web scraping and data extraction.
-
Scripting: Python's scripting capabilities make it valuable for writing scripts to automate system administration tasks, batch processing, and other routine operations.
-
Data Visualization: Libraries such as Matplotlib and Seaborn enable the creation of insightful visualizations to communicate findings effectively, aiding in data exploration and presentation.
-
Natural Language Processing (NLP): Python's NLTK and spaCy libraries provide tools for processing and analyzing textual data, enabling tasks such as sentiment analysis, named entity recognition, and text summarization.
-
Image Processing: Python's libraries like OpenCV offer extensive support for image processing tasks such as object detection, facial recognition, and image manipulation.
-
Scientific Computing: Python, coupled with libraries like SciPy, enables scientific computing tasks such as numerical integration, optimization, and solving differential equations.
-
Game Development: Python's simplicity and versatility make it suitable for game development, with libraries like Pygame providing tools for creating interactive games and simulations.
Top 50 Python Interview Questions With Answers
R
![]()
R is a powerful programming language and environment for statistical computing and graphics. With its extensive libraries and packages, R is widely used in data analysis, statistical modeling, and visualization tasks.
18 Free Datasets for Data Science Projects: Uncommon but Useful
-
Data Analysis: R offers a rich set of tools for data manipulation, exploration, and analysis, making it a popular choice for statistical analysis and research.
-
Statistical Modeling: With libraries like 'stats' and 'lme4', R facilitates the implementation of various statistical models for regression, ANOVA, and more.
-
Data Visualization: R's visualization packages, including ggplot2 and lattice, enable the creation of insightful and publication-quality visualizations to convey data findings effectively.
-
Machine Learning: R's libraries like caret and randomForest provide tools for machine learning tasks such as classification, regression, and clustering.
-
Time Series Analysis: R's time series packages, such as forecast and tseries, offer tools for analyzing and forecasting time series data.
-
Text Mining: R's text mining packages, such as tm and quanteda, facilitate tasks like sentiment analysis, topic modeling, and text classification.
-
Bioinformatics: R is widely used in bioinformatics for analyzing biological data, performing sequence analysis, and visualizing genomic data.
-
Econometrics: R's econometrics packages, such as plm and AER, support econometric analysis, including panel data analysis, instrumental variable regression, and more.
-
Spatial Analysis: R's spatial packages, like sp and raster, enable the analysis and visualization of spatial data, including mapping and spatial statistics.
-
Interactive Dashboards: R's Shiny framework allows for the creation of interactive web applications and dashboards to explore and visualize data dynamically
Jupyter Notebook
![]()
Jupyter Notebook is an open-source web application allowing users to create and share documents containing live code, equations, visualizations, and narrative text. With its interactive interface and support for multiple programming languages, Jupyter Notebook is widely used for data analysis, research, teaching, and collaboration.
Saravana's Inspiring Journey of Career Change and Learning Challenges
-
Interactive Computing: Jupyter Notebook provides an interactive environment for running code snippets, visualizing data, and exploring results, facilitating iterative data analysis and experimentation.
-
Data Visualization: With support for rich media integration, including plots, images, and interactive widgets, Jupyter Notebook enables the creation of dynamic and informative visualizations to communicate data insights effectively.
-
Documentation and Collaboration: Jupyter Notebook allows for the creation of interactive documents containing code, explanations, and visualizations, fostering collaboration and reproducibility in research and data analysis projects.
-
Education and Training: Jupyter Notebook is used extensively in education and training settings for teaching programming, data science, and other technical subjects, providing an interactive and engaging learning experience for students.
-
Presentation: Jupyter Notebook supports the creation of slideshows from notebooks, allowing presenters to showcase code, visualizations, and explanations in a structured and interactive format, enhancing the delivery of technical presentations and tutorials.
MongoDB

MongoDB is a document-oriented NoSQL database, known for its flexibility, scalability, and performance. It stores data in JSON-like documents, making it suitable for a wide range of use cases, including real-time analytics, content management, and mobile applications.
-
Flexible Data Model: MongoDB's document-based data model allows for flexible and dynamic schema design, accommodating evolving data requirements and simplifying data management.
-
Scalability: MongoDB is designed to scale horizontally across multiple servers, enabling high availability and seamless expansion to handle growing data volumes and user loads.
-
Querying and Indexing: MongoDB supports powerful query capabilities, including ad-hoc queries, aggregation pipelines, and geospatial queries, with support for indexing to optimize query performance.
-
Replication and High Availability: MongoDB provides built-in replication and automatic failover mechanisms, ensuring data durability and high availability in distributed environments.
-
Schema Validation: MongoDB allows for schema validation rules to enforce data integrity and consistency, preventing invalid data from being inserted into the database.
-
JSON-Like Documents: MongoDB stores data in JSON-like documents, making it easy to work with data in applications and enabling seamless integration with modern development frameworks and languages.
-
Real-Time Analytics: MongoDB's flexible data model and scalable architecture make it well-suited for real-time analytics and event-driven applications, enabling organizations to derive insights from streaming data sources.
-
Aggregation Framework: MongoDB's aggregation framework provides powerful tools for data analysis and manipulation, allowing users to perform complex aggregation operations, data transformations, and statistical calculations directly within the database.
-
Geospatial Capabilities: MongoDB supports geospatial indexes and queries, enabling the storage and querying of location-based data, such as maps, spatial coordinates, and geographic features.
-
Mobile and IoT Applications: MongoDB's flexible data model and support for mobile and IoT platforms make it an ideal choice for building applications that require offline data sync, real-time data processing, and seamless scalability.
Visualization Tools
Tableau
![]()
Tableau is a powerful data visualization tool used for creating interactive dashboards and reports. With intuitive drag-and-drop functionality, Tableau enables users to explore and visualize data effectively, making it valuable for business intelligence, data analysis, and decision-making.
-
Interactive Dashboards: Tableau allows users to create interactive dashboards and reports from various data sources, facilitating data exploration and analysis.
-
Data Visualization: With a wide range of visualization options and customization features, Tableau enables users to create insightful and visually appealing charts, graphs, and maps.
-
Business Intelligence: Tableau's analytics and visualization capabilities empower organizations to uncover insights, trends, and patterns in their data, facilitating data-driven decision-making and strategic planning.
-
Data Integration: Tableau seamlessly integrates with various data sources, including databases, spreadsheets, cloud services, and big data platforms, enabling users to access and analyze data from multiple sources in one place.
-
Collaboration: Tableau Server and Tableau Online facilitate collaboration and sharing of dashboards and reports among team members, promoting data-driven collaboration and decision-making across organizations.
-
Ad-hoc Analysis: Tableau enables users to perform ad-hoc analysis and exploratory data analysis (EDA) on the fly, allowing for quick insights and discoveries from raw data.
-
Real-time Data Interaction: Tableau supports real-time data connection and interaction, enabling users to visualize and analyze streaming data sources dynamically.
-
Predictive Analytics: With integrations with predictive analytics platforms like R and Python, Tableau enables users to incorporate predictive models and forecasts into their dashboards and reports.
-
Storytelling with Data: Tableau's storytelling features allow users to create narratives around their data, combining visualizations, text, and annotations to communicate insights effectively.
-
Mobile Accessibility: Tableau offers mobile applications for iOS and Android devices, allowing users to access and interact with Tableau dashboards and reports on the go.
Matplotlib
Matplotlib is a comprehensive plotting library for Python, enabling the creation of static, animated, and interactive visualizations. With its versatile functionality and customizable features, Matplotlib is widely used for data visualization, scientific plotting, and publication-quality graphics.
-
Plotting: Matplotlib offers a wide range of plotting functions and customization options for creating various types of plots, including line plots, scatter plots, bar charts, histograms, and more.
-
Customization: With extensive customization options for colors, styles, labels, annotations, and axes, Matplotlib enables users to create highly customized and visually appealing plots tailored to their specific requirements.
-
Integration: Matplotlib seamlessly integrates with other Python libraries and frameworks, including NumPy, Pandas, and Jupyter Notebook, allowing users to combine data manipulation, visualization, and analysis seamlessly in their workflows.
-
Publication Quality: Matplotlib produces publication-quality graphics suitable for academic papers, reports, presentations, and other professional publications, making it a preferred choice for scientific plotting and data visualization tasks.
-
Interactive Visualization: Matplotlib supports interactive plotting capabilities through integration with libraries like mpld3 and Plotly, enabling users to create dynamic and interactive visualizations for exploring data and sharing insights.
-
Animation: Matplotlib allows users to create animated visualizations and simulations, enabling the visualization of dynamic data and processes over time.
-
3D Plotting: Matplotlib includes functions for creating 3D plots and visualizations, allowing users to explore and analyze three-dimensional datasets and structures.
-
Multiple Axes and Subplots: Matplotlib supports multiple axes and subplots within a single figure, enabling users to create complex layouts and arrangements of plots for comparison and analysis.
-
Exporting and Saving: Matplotlib allows users to export plots to various file formats, including PNG, PDF, SVG, and EPS, for sharing and inclusion in documents, presentations, and publications.
-
Community Support: Matplotlib has a large and active community of users and developers, providing extensive documentation, tutorials, and resources for learning and using the library effectively.

Machine Learning and NLP Tools for Data science
Scikit-learn
![]()
Scikit-learn is a versatile machine learning library for Python, offering a wide range of supervised and unsupervised learning algorithms, as well as tools for model evaluation and selection. With its simple and consistent API, Scikit-learn is widely used for machine learning tasks in various domains.
-
Machine Learning Algorithms: Scikit-learn provides implementations of popular machine learning algorithms, including classification, regression, clustering, dimensionality reduction, and more, making it suitable for a wide range of predictive modeling tasks.
-
Model Evaluation: Scikit-learn offers tools for model evaluation and selection, including cross-validation, hyperparameter tuning, and performance metrics such as accuracy, precision, recall, F1-score, and ROC AUC, enabling users to assess and compare the performance of different models.
-
Feature Extraction and Transformation: Scikit-learn includes utilities for feature extraction, transformation, and preprocessing, such as scaling, normalization, imputation, encoding, and feature selection, helping