Power BI Dashboard- Projects and Case Study Findings

An excellent dashboard is not only going to show data but will also direct your focus, assist you in identifying problems or possibilities, and craft an effective story that will advance your business.
Just Imagine
You're flipping through a magazine filled with compelling data visualizations. Each page features a unique Power BI dashboard example:
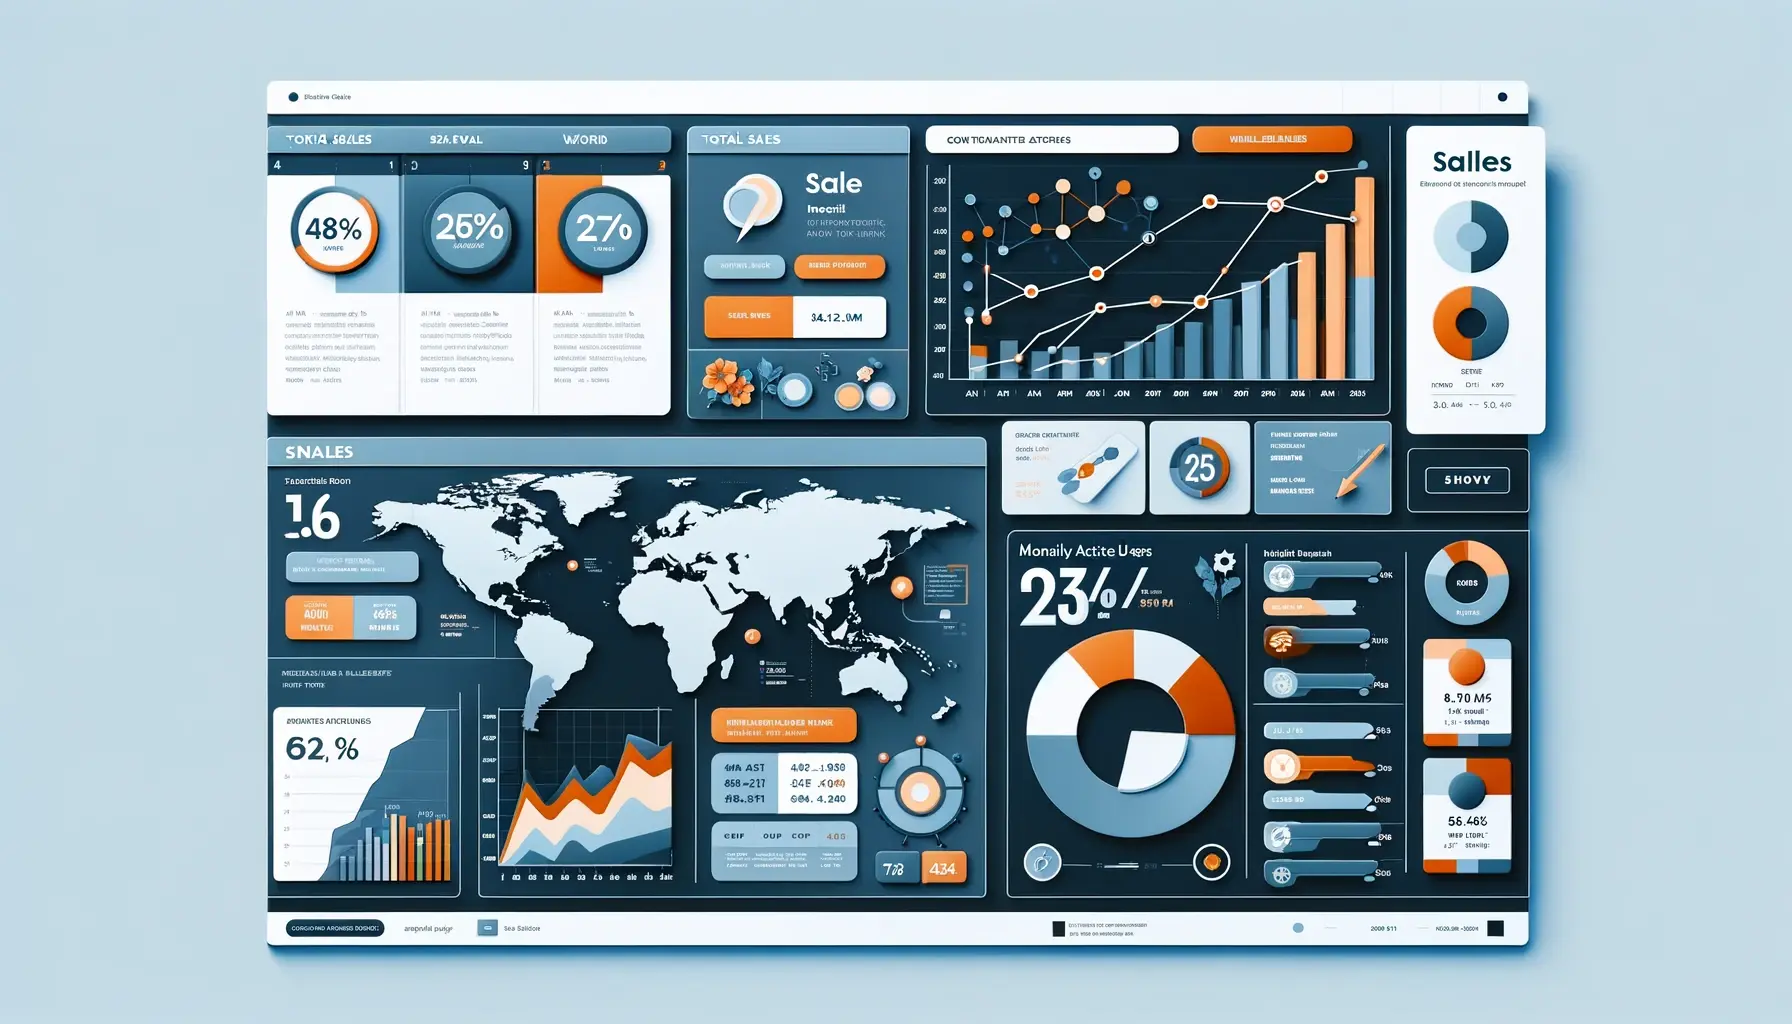
Page 1: A vibrant dashboard with a bar chart showcasing surging sales, a world map highlighting top-selling regions, and a KPI card displaying the overall sales growth percentage.
Page 2: A pie chart breaks down marketing campaign budget allocation, a stacked bar chart reveals website traffic sources, and a line graph tracks social media engagement over time.
Page 3: A gauge displays the current profit margin, a line graph tracks cash flow over a specific period, and a table summarizes key financial ratios.
Now, you would be like, WOW! This is exactly what I wanted to see!
Rather than drowning yourself in data, the dashboard would show you the exact graph needed to take action.

These are just a few examples of what Power BI dashboards can do. The possibilities are endless!
Must Read > Why Should You Be A Power BI Developer?
Top 7 Power BI Dashboards Abilities
#1: Data Aggregation and Integration
-
Multiple Data Sources: Power BI can connect to various data sources, including Excel spreadsheets, cloud-based data, and databases, allowing users to aggregate data from different places into a single dashboard.
-
Data Transformation: Users can transform and clean data within Power BI using the Power Query editor, preparing it for analysis without needing external tools.
#2: Interactive Visualizations
-
Custom Visualizations: Beyond the standard charts and graphs, Power BI allows for the creation of custom visualizations to better match the specific needs of any dataset or industry.
-
Dynamic Interactivity: Dashboards and reports are interactive, enabling end-users to drill down into data, filter views, and uncover deeper insights simply by clicking on visual elements.
#3: Real-time Analytics
-
Live Dashboards: Power BI can display real-time data, making it invaluable for monitoring operations that require up-to-the-minute information, such as sales, financial transactions, or system performance.
-
Automatic Refresh: Dashboards can be set to refresh at regular intervals, ensuring that the latest data is always available without manual intervention.
#4: Collaboration and Sharing
-
Power BI Service: Dashboards and reports can be published to the Power BI service, allowing for secure sharing with team members or stakeholders across an organization.
-
Collaborative Workspaces: Users can collaborate on dashboards and reports within their organization, enabling a more cohesive and unified approach to data analysis and decision-making.
#5: Advanced Analytics
-
AI Insights: Power BI integrates artificial intelligence capabilities, offering users advanced analytics features like forecasting, anomaly detection, and the use of natural language to create visualizations (Q&A feature).
-
Data Insights: The platform provides automatic insights, identifying patterns, trends, and correlations in the data that might not be immediately obvious.
#6: Security and Compliance
-
Row-level security: Power BI allows for row-level security, ensuring that users only see data relevant to them, which is crucial for maintaining data privacy and compliance.
-
Compliance Standards: Power BI adheres to global compliance standards, ensuring that data is handled securely and in accordance with regulatory requirements.
#7: Customization and Extensibility
-
Themes and Branding: Dashboards can be customized with themes and branding, allowing organizations to align them with their corporate identity.
-
Power BI API: The Power BI REST API enables the automation of dataset management, report creation, and integration with other applications, extending its capabilities beyond predefined features.
Power BI Dashboard: Case studies
Case Study 1: AMUL

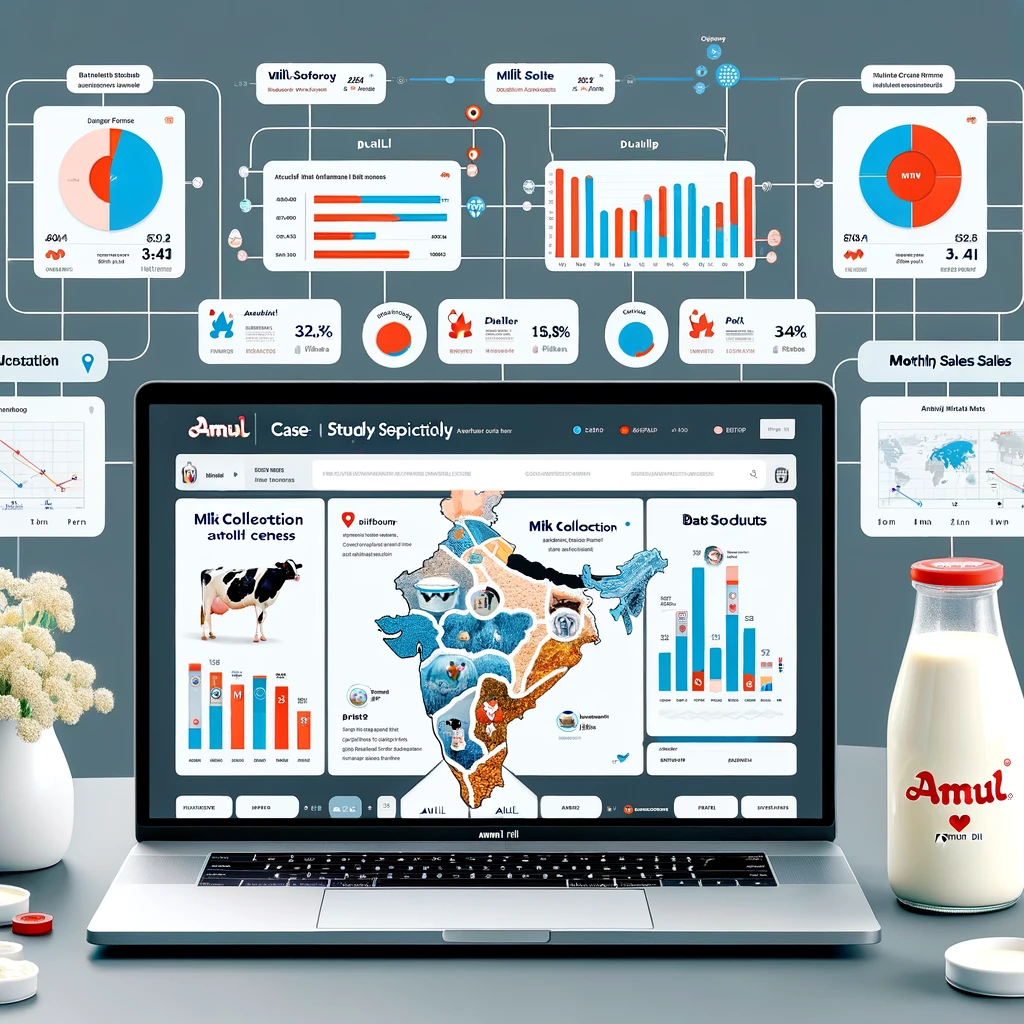
Amul, is a dairy giant in India, known for its extensive range of products. Despite its huge success, Amul faced challenges in managing its complex supply chain, which connects millions of milk producers with consumers across India.
Objective
The primary objective was to streamline the supply chain, from milk collection to product distribution, to ensure product freshness, reduce waste, and meet rapidly changing consumer demands efficiently.
Solution
Amul turned to Microsoft Power BI to enhance its decision-making processes and supply chain efficiency.

Outcome
The adoption of Power BI revolutionized Amul's operations with several key outcomes:
-
Improved Efficiency: Real-time data analytics helped streamline the supply chain, reducing time from farm to store and ensuring the freshness of dairy products.
-
Waste Reduction: Enhanced demand forecasting and inventory management led to significant reductions in product spoilage and waste.
-
Empowered Farmers: Data-driven insights helped improve the livelihoods of millions of milk producers by providing better support and enhancing milk yield and quality.
-
Consumer Satisfaction: By ensuring the availability of fresh products across its distribution network, Amul enhanced customer satisfaction and loyalty.
Conclusion
Amul's case study is a compelling example of how traditional businesses in India can embrace modern data analytics tools like Power BI to transform their operations. This story illustrates the profound impact that technology can have on the supply chain, by enhancing the efficiency of dairy operations.
Case Study 2: GE Healthcare
GE Healthcare, a leading global medical technology and digital solutions innovator, aims to leverage advanced cloud computing technologies to enhance healthcare services.
Objective
The primary goal was to improve enterprise imaging operations and financial performance, focusing on enhancing patient care while optimizing operational efficiency.

Solution
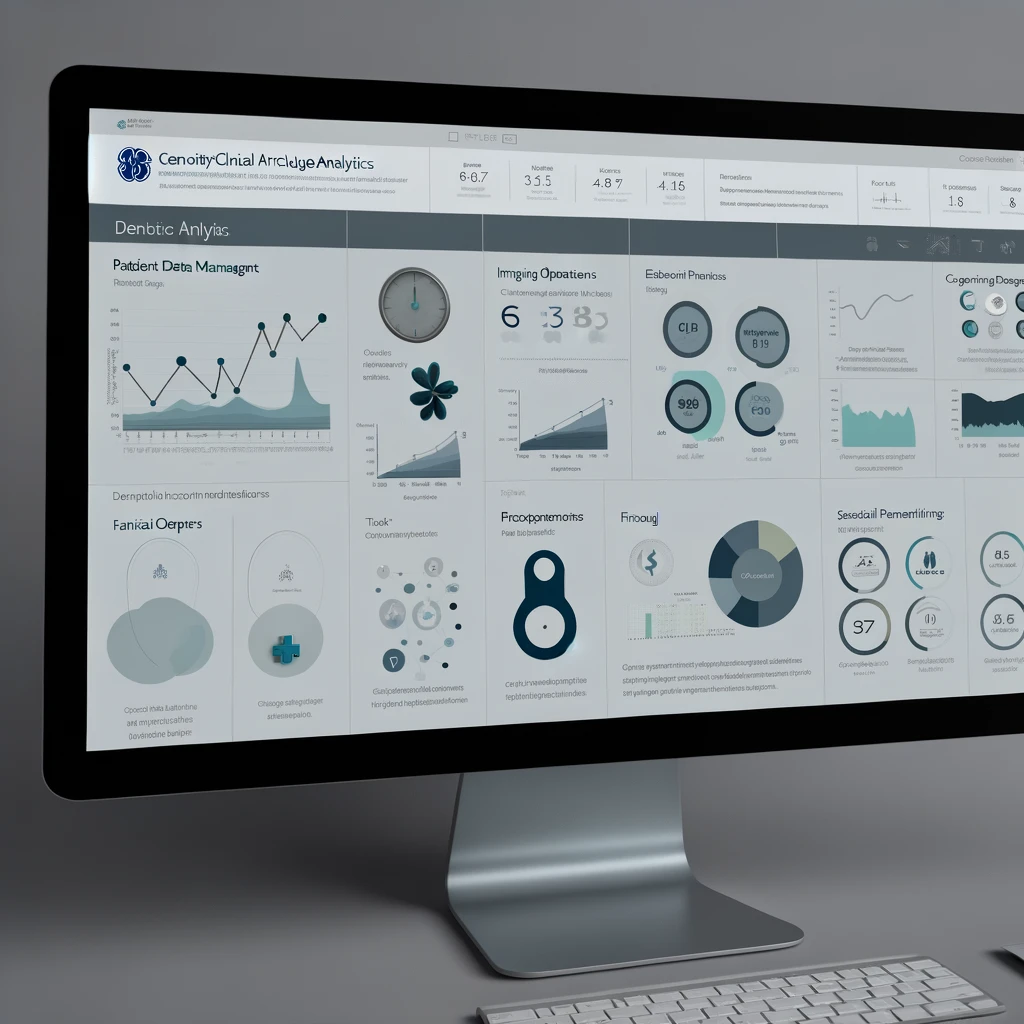
GE Healthcare chose Microsoft Azure and Power BI Embedded to create the Centricity™ Clinical Archive Analytics (CCA Analytics) service, a Vendor Neutral Archive (VNA) solution. This cloud-based service was designed to aggregate, analyze, and visualize vast amounts of healthcare data from various sources, including medical images and patient information.
Outcome
The deployment of CCA Analytics powered by Power BI Embedded led to significant advancements in healthcare analytics.
-
Enhanced Patient Care: Clinicians gained access to comprehensive patient data and insights, improving diagnostic accuracy and treatment plans.
-
Operational Efficiency: The analytics service streamlined imaging operations, reducing administrative burdens and facilitating better resource allocation.
-
Financial Performance: Insights into operational and clinical data helped GE Healthcare and its clients make informed decisions that positively impacted financial outcomes.
Conclusion
GE Healthcare's case study highlights the transformative impact of integrating Power BI with cloud computing technologies in the healthcare industry. By leveraging these advanced technologies, GE Healthcare was able to enhance patient care, improve operational efficiency, and boost financial performance, setting a benchmark for innovation in healthcare analytics.
Final Thoughts
In the realm of data, where complexity often clouds clarity, Power BI dashboards emerge as beacons of insight, transforming raw numbers into narratives that guide decision-making.
The above case studies illuminate just a fraction of Power BI's potential to revolutionize how we interact with data, driving efficiency, innovation, and strategic foresight across industries. As we navigate the data-driven landscapes of our industries, the mastery of tools like Power BI becomes not just an advantage but a cornerstone of professional development.
The decision to enroll in a Power BI course is the first step in a journey toward not only enhancing your analytical skills but also unlocking the door to new opportunities and innovations. It's an investment in your ability to see beyond the numbers, to extract and communicate actionable insights that can shape decisions and drive success.
A Power BI certification course offers more than just technical know-how; it provides the framework to think critically about data, to ask the right questions, and to weave compelling narratives that can influence and inspire. With each module and exercise, you'll gain confidence in your ability to transform data into meaningful insights, making you an invaluable asset to any team or project.
Whether you are a seasoned analyst, a business leader, or someone just beginning to explore the vast seas of data analytics, the journey with Power BI is filled with opportunities for growth and discovery.
Frequently Asked Questions (FAQ)

Q1: What is a Power BI report vs. dashboard?
In Power BI, a report is a detailed, multi-page collection of visuals and data analyses, while a dashboard is a single-page, summarized view of key metrics and trends, combining visuals from different reports. Reports offer in-depth data exploration, whereas dashboards provide a quick overview and high-level insights.
Q2: I have a non-tech background. Will I also be able to make a Power BI dashboard?
Yes, even with a non-tech background, you can create a Power BI dashboard. Power BI is designed to be user-friendly, with drag-and-drop features and intuitive interfaces that make it accessible even for beginners.
{% module_block module "widget_6cbe7731-2f4c-46f7-bf41-2f93e2ff0257" %}{% module_attribute "child_css" is_json="true" %}{% raw %}{}{% endraw %}{% end_module_attribute %}{% module_attribute "css" is_json="true" %}{% raw %}{}{% endraw %}{% end_module_attribute %}{% module_attribute "definition_id" is_json="true" %}{% raw %}null{% endraw %}{% end_module_attribute %}{% module_attribute "field_types" is_json="true" %}{% raw %}{"link":"text","text":"text"}{% endraw %}{% end_module_attribute %}{% module_attribute "label" is_json="true" %}{% raw %}null{% endraw %}{% end_module_attribute %}{% module_attribute "link" is_json="true" %}{% raw %}"https://www.odinschool.com/blog/biotech-student-turned-power-bi-developer-in-just-180-days"{% endraw %}{% end_module_attribute %}{% module_attribute "module_id" is_json="true" %}{% raw %}135590387735{% endraw %}{% end_module_attribute %}{% module_attribute "path" is_json="true" %}{% raw %}"/OdinSchool_V3/modules/Blog/blog - source links"{% endraw %}{% end_module_attribute %}{% module_attribute "schema_version" is_json="true" %}{% raw %}2{% endraw %}{% end_module_attribute %}{% module_attribute "smart_objects" is_json="true" %}{% raw %}null{% endraw %}{% end_module_attribute %}{% module_attribute "smart_type" is_json="true" %}{% raw %}"NOT_SMART"{% endraw %}{% end_module_attribute %}{% module_attribute "tag" is_json="true" %}{% raw %}"module"{% endraw %}{% end_module_attribute %}{% module_attribute "text" is_json="true" %}{% raw %}"Biotech Student Turned Power BI Developer in Just 180 Days!"{% endraw %}{% end_module_attribute %}{% module_attribute "type" is_json="true" %}{% raw %}"module"{% endraw %}{% end_module_attribute %}{% module_attribute "wrap_field_tag" is_json="true" %}{% raw %}"div"{% endraw %}{% end_module_attribute %}{% end_module_block %}Q3: I want to only study Power BI. So, is it mandatory for me to study data science as well?
No, it's not mandatory to study data science to learn Power BI. Power BI is a business analytics tool designed for data visualization and reporting, and you can become proficient in it without a deep background in data science. And, by enrolling in the Power BI certification course, the learning journey to gain proficiency in the tool becomes a little faster and easier.

