Decoding Data Science Process: A detailed Guide

So, you know when you hear people throwing around this term "Data Science"? It's basically the superhero of the tech world right now.
Imagine this: you're at a tech party, and someone mentions data science. Suddenly, it's like the room lights up with excitement. That's the level of buzz we're talking about.
But here's the deal – it's not just a passing trend. This stuff is on fire, and it's not cooling down any time soon. Why? Well, because our world is going full-on digital, and guess what powers that digital world?
You got it! DATA
Data is like the secret sauce that can cook up a whole new future. So, whether you're deep into tech or just curious about what all the fuss is about, data science is where it's at. It's like peeking into a crystal ball of what's coming next in our digital journey.
So, this blog is all about data science and the data science process.
Address the elephant in the room!
Well, imagine you have this massive pile of data, like tons and tons of it, from all sorts of sources – websites, sensors, social media, you name it. Data science is now the art and science of making sense of all that data.
It's like being a detective, but instead of solving crimes, you're uncovering insights and patterns hidden within the data.
So, how does it work? It's a bit like cooking. You gather your ingredients (that's your data), you mix them together (that's where the analysis comes in), and voilà, you've got yourself some tasty insights.
But why is it such a big deal? Well, because these insights can be super valuable for all sorts of things – like predicting trends, making business decisions, and even saving lives through medical research.
So, in a nutshell, data science is like the magic wand that turns raw data into valuable insights. Cool, right? And the person who does all this is called a data scientist. Not just data scientists, there are many other roles in data science, like data analyst, data engineer, data architect, etc. just like Prudhvi explained the difference in the roles neatly in his success story.
{% module_block module "widget_7c599937-3a80-4302-b742-1ae08840fabf" %}{% module_attribute "child_css" is_json="true" %}{% raw %}{}{% endraw %}{% end_module_attribute %}{% module_attribute "css" is_json="true" %}{% raw %}{}{% endraw %}{% end_module_attribute %}{% module_attribute "definition_id" is_json="true" %}{% raw %}null{% endraw %}{% end_module_attribute %}{% module_attribute "field_group" is_json="true" %}{% raw %}[{"blog_name":"Unlocking Success: AON Analyst's Middle-Class Climb to a 124% Salary Hike!","blog_summary":"","image_field":{"alt":"Prudhvi-Yerpula","height":280,"loading":"lazy","max_height":280,"max_width":680,"size_type":"auto","src":"https://odinschool-20029733.hs-sites.com/hubfs/Prudhvi%20Yerpula-2.webp","width":680},"link_field":{"no_follow":false,"open_in_new_tab":true,"rel":"noopener","sponsored":false,"url":{"content_id":null,"href":"https://www.odinschool.com/blog/unlocking-success-analysts-middle-class-climb-to-a-124-salary-rise","href_with_scheme":"https://www.odinschool.com/blog/unlocking-success-analysts-middle-class-climb-to-a-124-salary-rise","type":"EXTERNAL"},"user_generated_content":false}},{"blog_name":"Transition from a carefree lifestyle to becoming a data engineer at Kellogg's","blog_summary":"","image_field":{"alt":"Sanket-Vishwakarma","height":280,"loading":"lazy","max_height":280,"max_width":680,"size_type":"auto","src":"https://odinschool-20029733.hs-sites.com/hubfs/Sanket_Vishwakarma-2.webp","width":680},"link_field":{"no_follow":false,"open_in_new_tab":true,"rel":"noopener","sponsored":false,"url":{"content_id":null,"href":"https://www.odinschool.com/blog/success-story-backlogs-defeated-sankets-triumph-as-a-data-engineer-at-kelloggs","href_with_scheme":"https://www.odinschool.com/blog/success-story-backlogs-defeated-sankets-triumph-as-a-data-engineer-at-kelloggs","type":"EXTERNAL"},"user_generated_content":false}},{"blog_name":"The unseen shift from being a happy-go-lucky guy to a Data Scientist at ADA","blog_summary":"","image_field":{"alt":"Shobhit-Sharma","height":280,"loading":"lazy","max_height":280,"max_width":680,"size_type":"auto","src":"https://odinschool-20029733.hs-sites.com/hubfs/Shobhit%20Sharma-1.webp","width":680},"link_field":{"no_follow":false,"open_in_new_tab":true,"rel":"noopener","sponsored":false,"url":{"content_id":null,"href":"https://www.odinschool.com/blog/the-unseen-shift-shobhits-journey-from-being-a-carefree-guy-to-data-scientist","href_with_scheme":"https://www.odinschool.com/blog/the-unseen-shift-shobhits-journey-from-being-a-carefree-guy-to-data-scientist","type":"EXTERNAL"},"user_generated_content":false}}]{% endraw %}{% end_module_attribute %}{% module_attribute "field_types" is_json="true" %}{% raw %}{"field_group":"group"}{% endraw %}{% end_module_attribute %}{% module_attribute "label" is_json="true" %}{% raw %}null{% endraw %}{% end_module_attribute %}{% module_attribute "module_id" is_json="true" %}{% raw %}110804305745{% endraw %}{% end_module_attribute %}{% module_attribute "path" is_json="true" %}{% raw %}"/OdinSchool_V3/modules/Success stories Blog card"{% endraw %}{% end_module_attribute %}{% module_attribute "schema_version" is_json="true" %}{% raw %}2{% endraw %}{% end_module_attribute %}{% module_attribute "smart_objects" is_json="true" %}{% raw %}null{% endraw %}{% end_module_attribute %}{% module_attribute "smart_type" is_json="true" %}{% raw %}"NOT_SMART"{% endraw %}{% end_module_attribute %}{% module_attribute "tag" is_json="true" %}{% raw %}"module"{% endraw %}{% end_module_attribute %}{% module_attribute "type" is_json="true" %}{% raw %}"module"{% endraw %}{% end_module_attribute %}{% module_attribute "wrap_field_tag" is_json="true" %}{% raw %}"div"{% endraw %}{% end_module_attribute %}{% end_module_block %}
Data science job salaries are competitive, both in India and worldwide. Data science salaries vary depending on experience, skills, and industry. Here is data for top data science roles, responsibilities, and average salaries per experience.
What do people do in data science?
Well, there is a process that these data scientists, or rather any data science professional follows to get the right information out of data to make an informed decision making. This process is called as a data science process or data science lifecycle.
What are the different components of a data science process?
.webp)
Now, that we understand the different job roles in data science, data science process, let us know the different components of a data science process.
-
Data Analysis
This component involves techniques and methodologies for exploring, manipulating, and visualizing data to gain insights and make informed decisions.
It encompasses tasks such as data profiling, exploratory data analysis, and data visualization.
-
Statistics
Statistics plays a crucial role in data science by providing the theoretical foundation for data analysis and modeling.
This component includes concepts such as probability theory, hypothesis testing, regression analysis, and inferential statistics.
-
Machine Learning
Machine learning is a subset of artificial intelligence focused on developing algorithms and models that enable computers to learn from data and make predictions or decisions without being explicitly programmed.
This component involves tasks such as model selection, feature engineering, model training, and evaluation.
-
Programming
Proficiency in programming languages such as Python, R, or SQL is essential for Data scientists to manipulate data, implement algorithms, and build analytical solutions.
This component encompasses skills related to data manipulation, scripting, and software development.
-
Domain Knowledge
Domain knowledge refers to expertise in a specific industry or subject area, such as finance, healthcare, or marketing.
Understanding the domain context is crucial for framing problems, interpreting results, and generating actionable insights in Data Science projects.
These components represent foundational areas of knowledge and skills that Data Scientists or data science professionals leverage throughout the entire Data Science process, from data collection to model deployment. While they may not correspond directly to individual steps in the process, they are integral to the successful execution of Data Science projects.
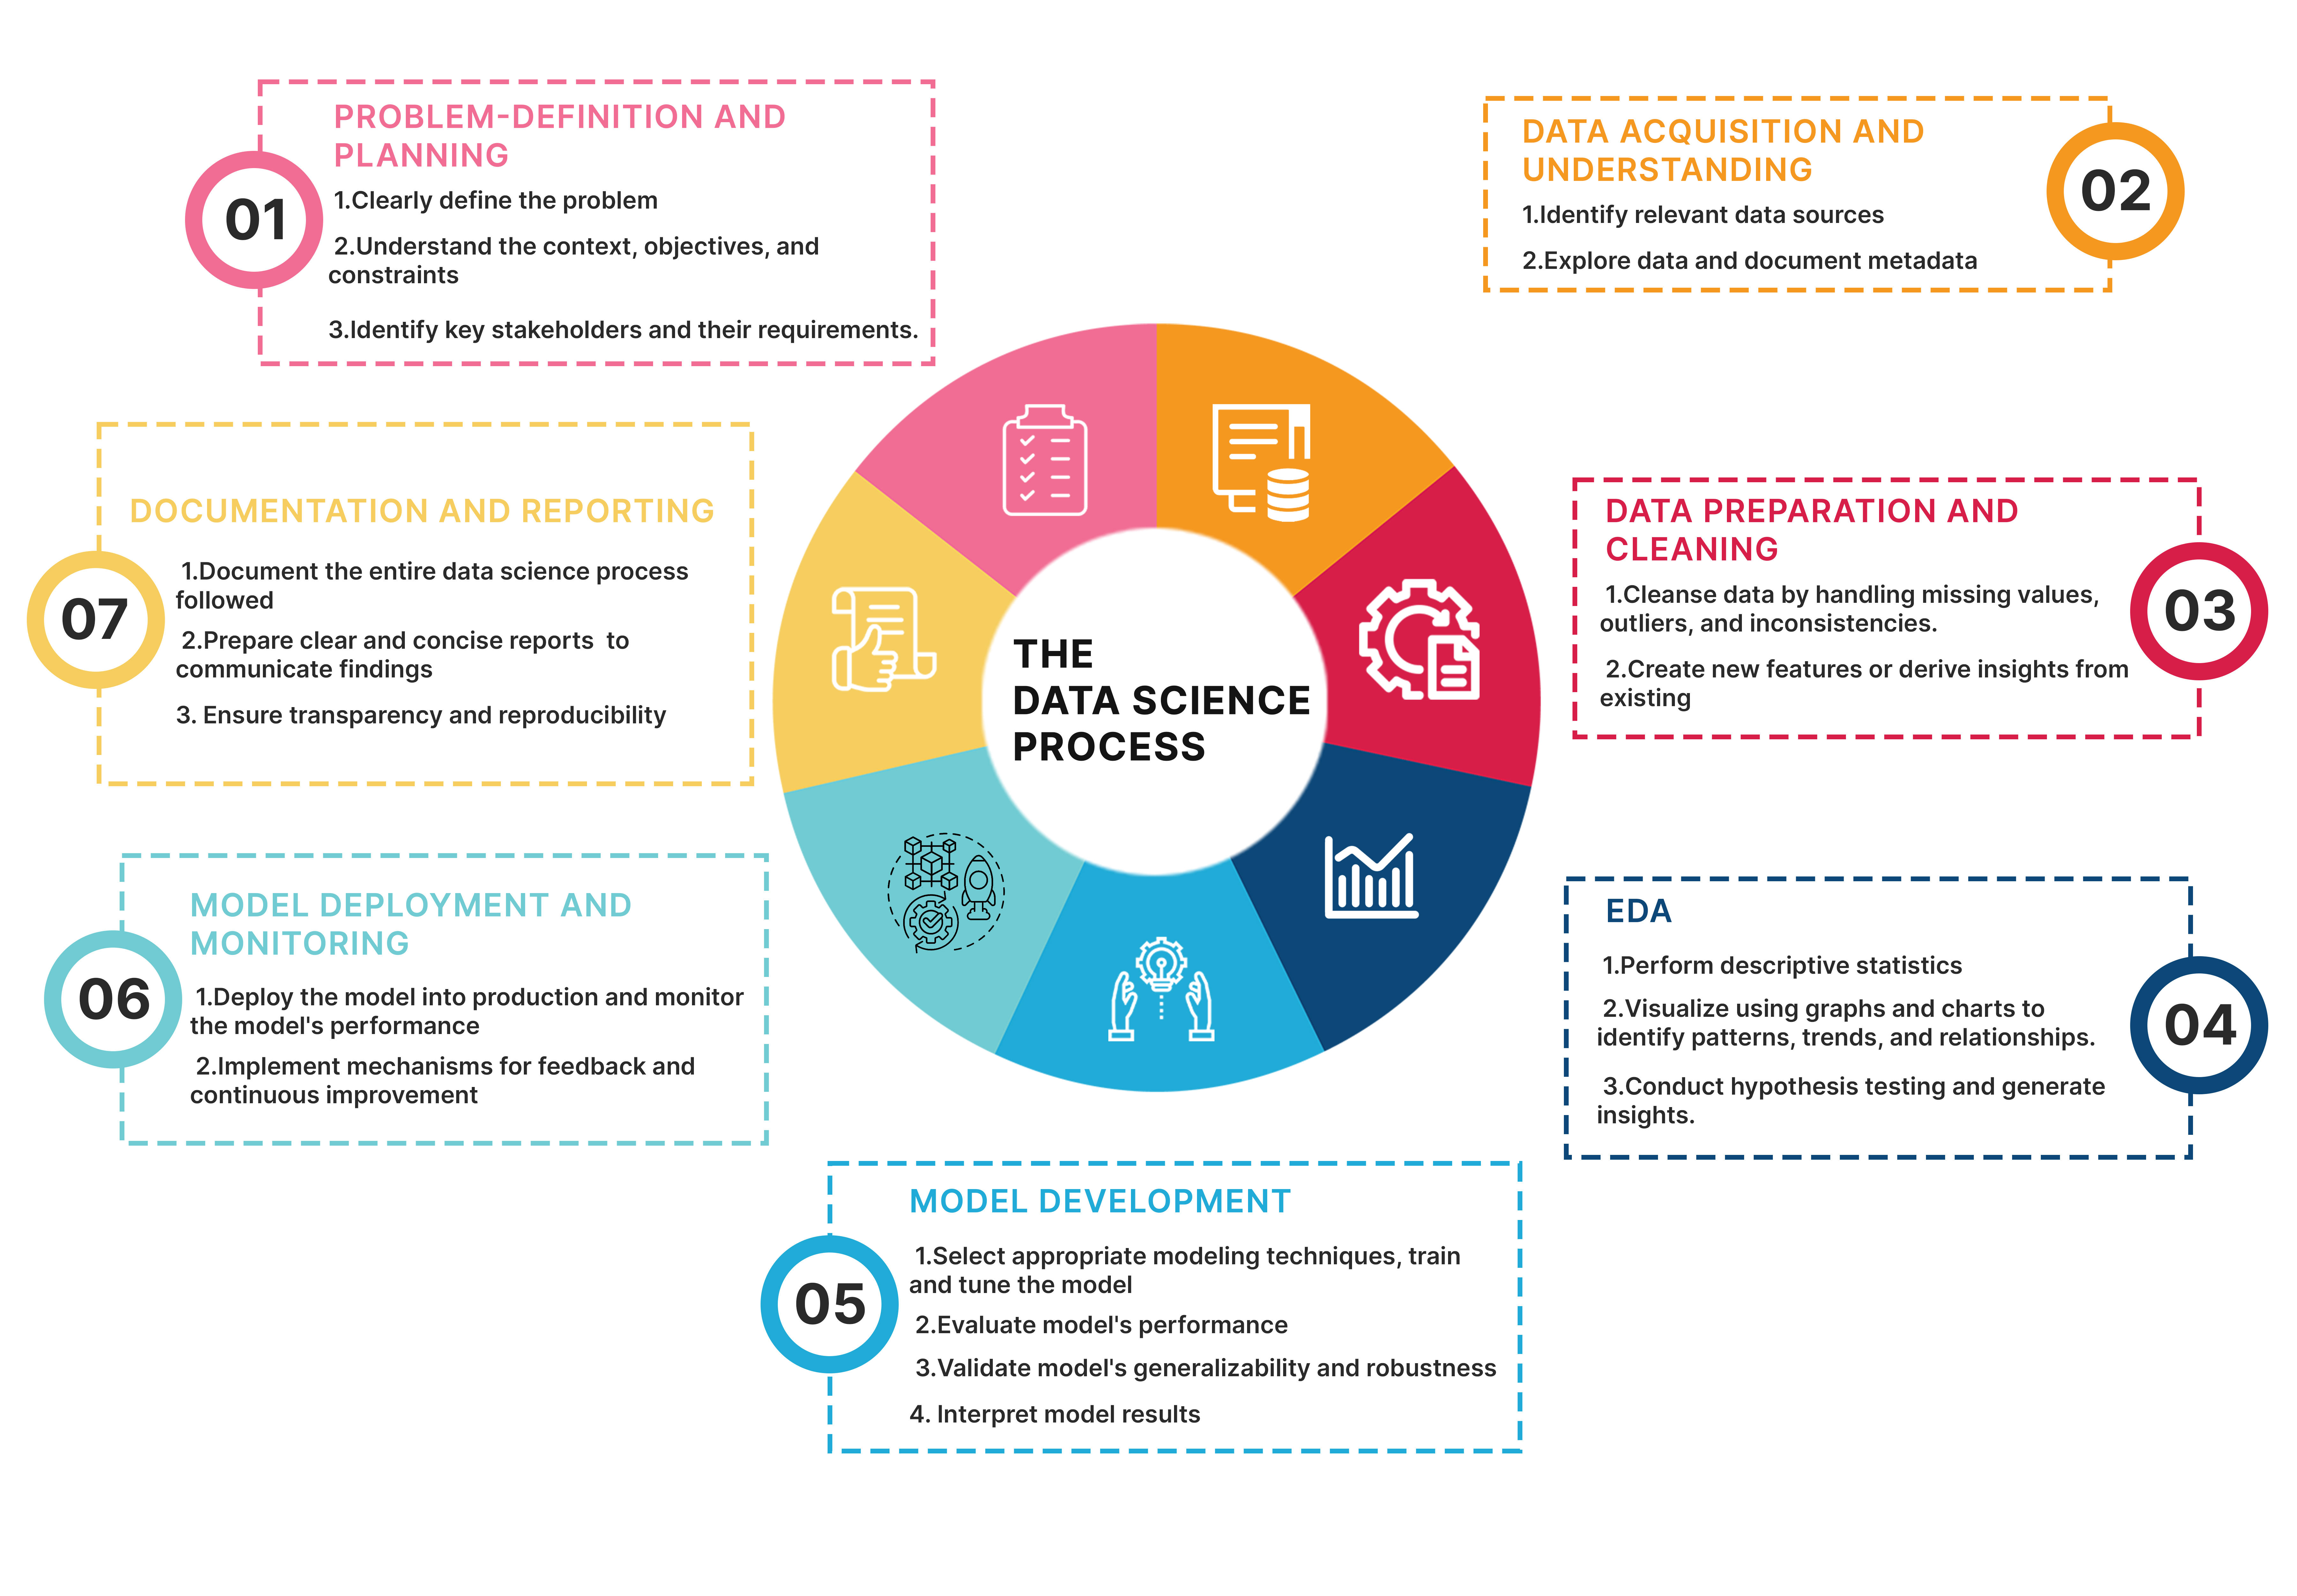
What is the data science process?
The Data Science process lifecycle is like a roadmap for tackling data-related problems and extracting insights from data. Here are the primary key stages or data science process steps for each of them.
Step 1 - Problem Formulation and Understanding
Problem formulation and understanding is a critical phase in the process of solving any problem, particularly in the fields of research, engineering, data science, and computer programming.

-
Problem Identification: Recognizing and defining the issue that needs to be addressed. This involves distinguishing symptoms from the root cause of the problem.
-
Requirement Analysis: Understanding the needs and constraints related to the problem. This includes identifying the stakeholders, their needs, and any limitations or restrictions on the possible solutions.
-
Objective Setting: Defining clear, specific, and achievable goals for what the solution should accomplish. Objectives should be measurable so that the success of the solution can be evaluated.
-
Data Collection and Analysis: Gathering relevant information, data, and resources that can help in understanding the problem more deeply. This step often involves quantitative and qualitative analysis.
-
Hypothesis Formulation: Based on the data and analysis, form hypotheses about the potential causes of the problem or potential solutions. This helps in structuring the subsequent steps of problem-solving.
-
Solution Space Definition: Identifying and delineating the range of possible solutions or approaches to address the problem. This step involves creative and critical thinking to explore various options.
-
Constraint Identification: Recognizing any limitations or restrictions that must be considered in solving the problem. Constraints can be technical, financial, temporal, or related to human resources.
-
Assumptions and Dependencies: Clearly stating any assumptions made during the problem formulation and identifying dependencies that could impact the problem-solving process or the implementation of solutions.
Step 2 - Data Acquisition and Understanding
Data Acquisition and Understanding form a crucial phase in the lifecycle of data-driven projects, including those in data science, machine learning, and analytics. This phase bridges the initial problem formulation and the subsequent modeling and analysis stages
-
Identifying Relevant Data Sources and Acquiring Datasets:
-
This involves identifying sources from which relevant data can be obtained. These sources could be databases, APIs, files, web scraping, or even manual data collection.
-
Depending on the project requirements, data may need to be sourced from internal databases within an organization, public repositories, or third-party providers.
-
Acquiring datasets involves obtaining permission if necessary, ensuring data legality and ethics, and obtaining the data in a format suitable for analysis. This might involve cleaning and preprocessing steps to ensure data quality.
-
-
Exploring the Data:
-
Once the data is acquired, it's essential to explore it to understand its characteristics fully. This exploration involves examining the structure, format, and content of the data.
-
Assessing the quality of the data involves checking for missing values, inconsistencies, duplicates, and other anomalies that might affect the analysis.
-
It's also crucial to be aware of potential biases in the data, such as sampling bias or measurement bias, which could lead to skewed results or inaccurate conclusions.
-
-
Documenting Metadata and Gaining Domain Knowledge:
-
Documenting metadata involves recording essential information about the data, including its source, format, variables, and any transformations applied during preprocessing.
-
Metadata documentation facilitates reproducibility and collaboration among team members by providing a clear understanding of the data's characteristics.
-
Gaining domain knowledge about the data involves understanding the context in which the data was generated, the semantics of the variables, and any domain-specific considerations that may impact the analysis.
-
Step 3 - Data preparation and cleaning
Data preparation and cleaning are essential stages in the data analysis process, aimed at ensuring that the data is in a suitable format for analysis and free from errors or inconsistencies.
-
Handling Missing Values:
-
Missing values are a common issue in datasets and can arise due to various reasons such as data entry errors, equipment malfunction, or intentional omission.
-
Techniques for handling missing values include imputation (replacing missing values with estimates such as mean, median, or mode), deletion (removing records or variables with missing values), or advanced methods like predictive modeling.
-
The choice of technique depends on the nature of the data and the impact of missing values on the analysis.
-
-
Dealing with Outliers:
-
Outliers are data points that deviate significantly from the rest of the dataset and can distort statistical analyses.
-
Identifying outliers involves visual inspection through techniques like box plots, histograms, or scatter plots, as well as statistical methods such as z-scores or Tukey's method.
-
Depending on the nature of the outliers and the analysis goals, outliers can be removed, transformed, or treated separately in the analysis.
-
-
Data Transformation:
-
Data transformation involves converting the data into a more suitable format for analysis or modeling.
-
Common transformations include normalization (scaling numerical variables to a standard range), log transformation (for skewed distributions), or encoding categorical variables into numerical format.
-
Transformation can also involve creating new variables or aggregating existing ones to extract additional insights from the data.
-
-
Handling inconsistent Data:
-
Inconsistent data may include inconsistencies in formatting, units of measurement, or coding schemes.
-
Standardizing data involves ensuring consistency across variables by converting units, standardizing date formats, or correcting coding errors.
-
Data validation techniques such as cross-field validation or range checks can be used to identify and correct inconsistencies in the data.
-
-
Addressing Data Quality Issues:
-
Data quality issues such as duplication or inaccuracies can undermine the reliability of analysis results.
-
Cleaning techniques involve identifying and correcting errors in the data using validation checks, deduplication algorithms, or manual inspection.
-
Establishing data quality metrics and conducting data profiling can help in assessing the overall quality of the dataset and prioritizing cleaning efforts.
-

Step 4 - Exploratory Data Analysis (EDA)
Exploratory Data Analysis (EDA) is a crucial preliminary step in data analysis, aimed at summarizing the main characteristics of a dataset, understanding its underlying structure, and identifying patterns, trends, and relationships within the data.
-
Data Summarization:
-
EDA begins with summarizing the main characteristics of the dataset, including measures of central tendency (mean, median, mode), dispersion (standard deviation, range), and distribution (skewness, kurtosis).
-
Summarizing categorical variables involves counting the frequency of each category and visualizing their distribution through bar charts or pie charts.
-
-
Data Visualization:
-
Visualization plays a central role in EDA, enabling analysts to explore the data graphically and gain insights that may not be apparent from numerical summaries alone.
-
Common visualization techniques include histograms for visualizing distributions, box plots for comparing distributions, scatter plots for exploring relationships between variables, and heatmaps for visualizing correlation matrices.
-
Interactive visualization tools allow analysts to explore multidimensional datasets and uncover complex patterns through dynamic filtering and zooming.
-
-
Identifying Patterns and Trends:
-
EDA involves identifying patterns, trends, and anomalies within the data. This may include seasonality in time series data, clusters in multivariate data, or trends over time in longitudinal data.
-
Techniques such as trend analysis, time series decomposition, and cluster analysis help in identifying and interpreting patterns within the data.
-
-
Relationship Analysis:
-
EDA explores relationships between variables to uncover dependencies, associations, and correlations.
-
Scatter plots and correlation matrices are commonly used to visualize relationships between pairs of variables, while multivariate techniques such as principal component analysis (PCA) and multidimensional scaling (MDS) help in exploring relationships in high-dimensional datasets.
-
-
Outlier Detection:
-
Outliers are data points that deviate significantly from the rest of the dataset and can impact the analysis results.
-
EDA involves identifying outliers through visual inspection and statistical techniques such as z-scores, Tukey's method, or robust estimators.
-
-
Data Transformation and Feature Engineering:
-
EDA may involve transforming variables to meet modeling assumptions or engineering new features to improve predictive performance.
-
Common transformations include log transformation for skewed distributions, standardization for numerical variables, and one-hot encoding for categorical variables.
-
-
Interactive Exploration and Iterative Analysis:
-
EDA is an iterative process that involves exploring the data interactively, generating hypotheses, and refining analysis techniques based on insights gained.
-
Interactive tools and dashboards facilitate exploratory analysis by enabling analysts to dynamically visualize and manipulate the data in real-time.
-

Step 5 - Model development
Model development is a crucial phase in data analysis, where statistical or machine learning models are built to predict outcomes, uncover patterns, or gain insights from data. Here are the key aspects of model development:
-
Problem Formulation and Goal Definition:
-
The first step in model development is to clearly define the problem statement and establish the goals of the analysis.
-
This involves understanding the business or research objectives, defining the target variable to be predicted or analyzed, and identifying the relevant predictors or features.
-
-
Data Preparation and Preprocessing:
-
Before building a model, the data needs to be prepared and preprocessed to ensure its quality and suitability for analysis.
-
This may involve handling missing values, encoding categorical variables, scaling numerical features, and splitting the data into training and testing sets.
-
-
Feature Selection and Engineering:
-
Feature selection involves identifying the most relevant predictors or features that contribute to the predictive power of the model.
-
Feature engineering may involve creating new features from existing ones, transforming variables, or extracting meaningful information to improve model performance.
-
-
Model Selection:
-
Choosing the appropriate model depends on various factors including the nature of the problem, the type of data, and the desired outcome.
-
Common model types include linear regression, logistic regression, decision trees, random forests, support vector machines, neural networks, and ensemble methods.
-
Model selection may involve comparing the performance of different models using metrics such as accuracy, precision, recall, F1-score, or area under the ROC curve (AUC).
-
-
Model Training:
-
Once the model is selected, it needs to be trained on the training data to learn the underlying patterns and relationships.
-
Training involves optimizing the model parameters to minimize the error between the predicted and actual values.
-
-
Model Evaluation:
-
After training, the model's performance is evaluated using the testing data to assess its generalization ability.
-
Evaluation metrics depend on the type of problem and the goals of the analysis, and may include accuracy, precision, recall, F1-score, mean squared error (MSE), or area under the ROC curve (AUC).
-
-
Hyperparameter Tuning:
-
Hyperparameters are parameters that control the behavior of the model and are not learned during training.
-
Hyperparameter tuning involves selecting the optimal values for hyperparameters through techniques such as grid search, random search, or Bayesian optimization to improve model performance.
-

Step 6 - Model Deployment and Monitoring
Model deployment and monitoring are crucial steps in the lifecycle of a machine learning model, ensuring that it continues to perform effectively and reliably in production. Here are the key aspects of model deployment and monitoring:
-
Deployment Strategies:
-
Model deployment involves making the trained model accessible to end-users or integrating it into the existing software infrastructure.
-
Deployment strategies vary depending on the application requirements and infrastructure capabilities, and may include deploying models as RESTful APIs, embedded within applications, or using containerization platforms like Docker.
-
-
Scalability and Performance:
-
Deployed models should be able to handle varying loads and scale seamlessly to accommodate increasing demand.
-
Performance considerations such as response time, throughput, and resource utilization need to be optimized to ensure efficient and cost-effective operation.
-
-
Versioning and Rollback:
-
Version control is essential for managing changes to deployed models and facilitating rollback in case of errors or performance degradation.
-
Techniques such as model versioning and A/B testing enable organizations to deploy multiple versions of a model concurrently and evaluate their performance against predefined metrics.
-
-
Monitoring and Health Checks:
-
Continuous monitoring is critical for detecting and diagnosing issues with deployed models in real-time.
-
Health checks and monitoring metrics such as prediction latency, error rates, data drift, and model drift help in identifying anomalies and performance degradation.
Model Drift Detection:
-
Model drift occurs when the relationship between the input features and the target variable changes over time, leading to deterioration in predictive performance.
-
Techniques such as monitoring prediction accuracy or comparing model outputs with ground truth labels help in detecting model drift and triggering retraining or recalibration of the model.
-
-
Security and Compliance:
-
Deployed models should adhere to security best practices to protect against unauthorized access, data breaches, and malicious attacks.
-
Compliance with regulatory requirements such as GDPR, HIPAA, or industry-specific standards is essential to ensure data privacy and maintain trust with stakeholders.
-
-
Feedback Loop and Continuous Improvement:
-
Establishing a feedback loop enables organizations to collect user feedback, monitor model performance, and incorporate insights into iterative model improvement.
-
Continuous improvement involves regularly updating and retraining models based on new data, feedback, and changing business requirements to ensure ongoing relevance and effectiveness.
-

Step 7 - Documentation and Reporting
Documentation and reporting are essential components of any data analysis or machine learning project, ensuring transparency, reproducibility, and effective communication of findings. Here are the key aspects of documentation and reporting:
-
Project Documentation:
-
Project documentation provides a comprehensive overview of the entire data analysis or machine learning project, including its objectives, methodologies, datasets used, and key findings.
-
Documentation should include detailed descriptions of data sources, preprocessing steps, feature engineering techniques, model selection criteria, and evaluation metrics.
-
Clear and organized documentation facilitates collaboration among team members, enables reproducibility of results, and helps in troubleshooting and debugging issues.
-
-
Code Documentation:
-
Code documentation involves adding comments, annotations, and explanatory notes within the codebase to clarify its purpose, functionality, and implementation details.
-
Comments should describe the logic behind complex algorithms, explain the significance of specific code blocks, and provide references to relevant literature or documentation.
-
Adopting consistent coding conventions and documentation standards improves code readability and maintainability, making it easier for other team members to understand and modify the code.
-
-
Model Documentation:
-
Model documentation includes detailed descriptions of the trained models, including their architecture, hyperparameters, training process, and performance metrics.
-
Model documentation should also highlight any assumptions, limitations, or constraints associated with the model, as well as recommendations for its usage and interpretation.
-
Visualizations such as model diagrams, feature importance plots, and performance metrics tables help in conveying complex information about the model in an accessible format.
-
-
Report Writing:
-
Report writing involves summarizing the key findings, insights, and recommendations derived from the data analysis or machine learning project.
-
Reports should be structured logically, with clear headings, subheadings, and sections that guide the reader through the analysis process.
-
Each section of the report should provide context, explain the analysis techniques used, present the results, and draw conclusions based on the findings.
-
Visual aids such as charts, graphs, tables, and diagrams help in illustrating key points and supporting the narrative of the report.
-
-
Audience Consideration:
-
When preparing documentation and reports, it's essential to consider the intended audience and tailor the content accordingly.
-
Technical documentation may include detailed technical specifications, code snippets, and mathematical formulas suitable for data scientists and engineers.
-
Non-tech
-