What is Power BI Used For? A Quick Guide to its Applications and Benefits

Have you ever wondered how businesses make decisions that lead to growth and success?

In today’s world, data-driven decision-making is at the heart of any effective business strategy. But how do companies transform overwhelming amounts of raw data into actionable insights?
One of the most powerful tools for this purpose is Power BI. It offers a suite of tools that can make complex data easy to understand through intuitive visuals and interactive reports. In this article, we’ll dive into its various applications and explore how it can benefit both businesses and individuals.
If you want to dive deeper into Power BI use cases, you can check out our article on Advanced tips and tricks for Power Users.
What is Power BI?
Power BI is a business intelligence tool created by Microsoft, specifically designed to help users visualize, analyse, and interpret data. This platform allows users to connect various data sources, process the data, and create interactive and intuitive dashboards and reports that provide a comprehensive view of business metrics.
It caters to diverse audiences, including small businesses, large enterprises, and individual analysts, making it a versatile solution for data visualization and analytics.
The tool is part of the Microsoft Power Platform suite, making it easy for businesses already invested in Microsoft products to integrate it seamlessly into their workflows. Power BI is built to simplify data processes, enabling users to make informed decisions based on real-time data.
Power BI Full Form
The full form of Power BI is Power Business Intelligence. True to its name, Power BI combines "powerful" data analytics capabilities with "business intelligence" features to help organizations gain insights from their data in a visually engaging and interactive manner.Microsoft has developed it to be highly intuitive, ensuring that even non-technical users can harness its potential to create impactful data stories.
Key Uses of Power BI
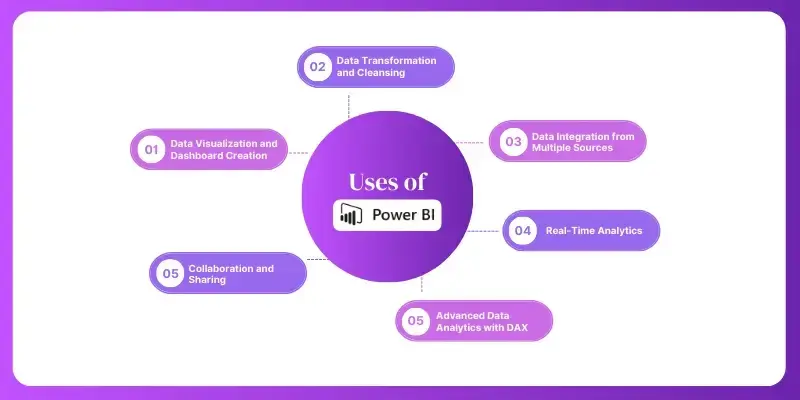
Power BI serves as a multi-functional tool that goes beyond basic data visualization. Below are some of the main Power BI uses that make it indispensable in various industries:

1. Data Visualization and Dashboard Creation
One of Power BI’s primary uses is creating visually appealing dashboards and charts. These dashboards allow businesses to gain a quick overview of their performance indicators, such as sales trends, customer engagement, and operational efficiency. With Power BI’s drag-and-drop functionality, users can create custom visuals like bar charts, pie charts, and interactive maps, which make data easier to interpret.
2. Data Transformation and Cleansing
Power BI’s Power Query feature allows users to cleanse, transform, and reshape their data. This feature is especially useful for businesses dealing with large datasets from multiple sources. Power Query enables users to remove inconsistencies, correct data errors, and shape data for better analysis. By ensuring that data is accurate and clean, Power BI helps organizations make decisions based on reliable insights.
3. Data Integration from Multiple Sources
Another powerful feature of Power BI is its ability to connect with various data sources. Users can integrate data from multiple platforms, including Excel, SQL databases, Google Analytics, Salesforce, and even third-party services. This functionality allows users to analyze data in a unified dashboard without having to manually consolidate information from different sources.
4. Real-Time Analytics
For businesses that require instant insights, Power BI offers real-time analytics and live data streaming. Real-time analytics are particularly useful for sectors like retail, logistics, and customer service, where immediate responses are crucial. By tracking data in real-time, companies can identify trends as they happen, make immediate adjustments, and improve customer satisfaction.
5. Advanced Data Analytics with DAX
Power BI offers Data Analysis Expressions (DAX), a robust formula language for data modeling. DAX enables users to create custom calculations and metrics, adding depth to their data analysis. With DAX, Power BI can perform complex calculations, making it easier for data professionals to derive valuable insights that aren’t immediately visible from raw data.
6. Collaboration and Sharing
Power BI makes collaboration seamless with Power BI Service, a cloud-based feature that enables users to share their dashboards and reports with colleagues. By sharing insights, team members can work together to analyze data and make data-driven decisions. The ability to publish reports online or embed them into company portals also makes it easier for executives to access insights.
Benefits of Power BI
Power BI offers numerous advantages to businesses and professionals, regardless of their industry or data expertise. Below are some of the primary benefits of Power BI:
1. User-Friendly Interface
One of the reasons Power BI is so widely adopted is its user-friendly design. The tool is intuitive, with easy-to-navigate menus and drag-and-drop functionalities, which reduces the learning curve and enables users without technical backgrounds to create complex dashboards.
2. Cost-Effective Solution
Power BI provides excellent value for money. With Power BI Desktop available for free and additional paid plans for Power BI Pro and Premium versions, businesses can choose a plan that aligns with their budget. Even with a minimal investment, Power BI delivers substantial functionality that matches, and sometimes surpasses, other high-cost business intelligence tools.
3. Customizable Reports and Dashboards
The flexibility of Power BI allows users to design custom reports that fit their unique requirements. Customization options include report layouts, color schemes, chart types, and more. Businesses can tailor their reports and dashboards to reflect specific KPIs, making it easier to track progress towards goals.
4. Enhanced Data Security
Power BI complies with industry standards and ensures data privacy and security. For organizations dealing with sensitive information, Power BI offers features like role-based access, data encryption, and security protocols to safeguard data. Microsoft also provides multi-factor authentication, making Power BI a secure platform for managing business data.
5. AI-Powered Insights
With AI-driven features like Q&A and Key Influencers, Power BI allows users to leverage machine learning and artificial intelligence to gain deeper insights. The Q&A feature lets users ask questions in natural language, and Power BI provides answers in the form of visuals. Key Influencers help users understand factors that impact specific metrics, adding a layer of predictive analytics to business intelligence.
Understanding Power BI Reports
Power BI Reports are multi-page documents that provide in-depth insights into various data sets. Unlike dashboards, which give an overview of key metrics, reports offer detailed information on specific areas, making it easier to analyze data comprehensively.
Power BI Reports come with several features:
- Multi-Layered Pages: Reports can contain multiple pages, each offering insights into different aspects of a business.
- Interactive Visuals: Users can interact with visuals, filter data, and drill down to specific data points to get granular insights.
- Customizable Filters: Users can add filters to reports to narrow down data views and focus on specific criteria.
These reports are instrumental in helping organizations understand complex data patterns and support strategic decision-making.
Who Should Use Power BI?
Power BI’s functionality is beneficial across a variety of roles and industries. Here are some professionals who can benefit the most:
- Business Analysts: Power BI empowers analysts to create impactful visualizations, transforming raw data into actionable insights.
- Data Scientists: With DAX and advanced analytics, data scientists can create complex models and perform predictive analysis.
- Marketing Teams: Marketers can track campaign performance, customer behavior, and ROI, helping them optimize marketing strategies.
- Operations Managers: Power BI helps operations teams monitor efficiency metrics, identify bottlenecks, and streamline workflows.
- Executives: Power BI’s dashboards provide executives with real-time insights, enabling them to make informed decisions quickly.
Bottom Line
In today’s data-centric world, Power BI stands out as an invaluable tool for those aiming to harness the potential of data effectively. Its user-friendly interface, cost-effectiveness, and seamless integration capabilities make it a versatile solution for businesses across industries.
As we’ve explored, Power BI’s uses extend from data visualization to advanced analytics, empowering users to make informed decisions with confidence. And if you're considering taking your skills further, enrolling in a Power BI Course could be a great next step, providing hands-on experience and deeper knowledge. By mastering Power BI, you can unlock the full potential of data for strategic growth and success!