Covariance
We already discussed that the measures we are reviewing are to do with the relation between variables. Covariance tells us if there is a relationship between variables in a data set and how strong it is.
Let's go back to our ice cream sales example. Here is the data for the sales for a given week with the max temperature and the sales. We choose the max temperature to make things simple and also because the temperature keeps fluctuating throughout the day.
| Day | Max temperature (°C) | Number of ice cream units sold |
| Sunday | 23 | 50 |
| Monday | 25 | 70 |
| Tuesday | 21 | 35 |
| Wednesday | 23 | 45 |
| Thursday | 26 | 66 |
| Friday | 28 | 80 |
| Saturday | 26 | 58 |
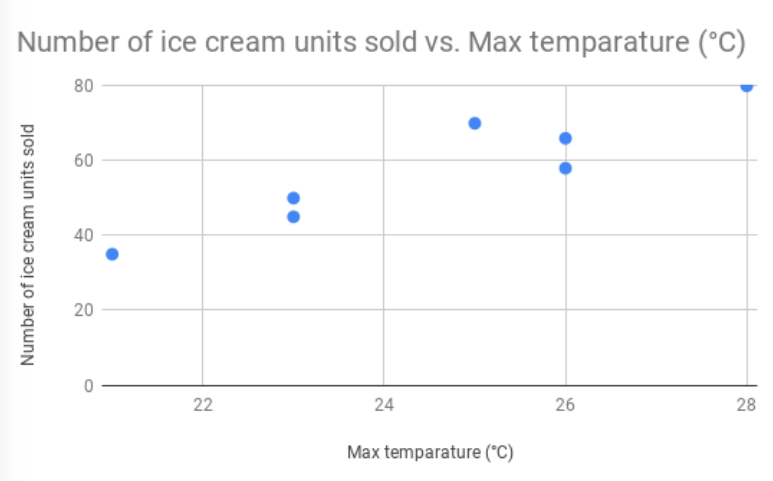
Let's plot a scatter plot on this data and see if we can see a pattern in it.

Clearly, you can see the pattern here. As temperatures soar, ice cream sales go up.
Let's calculate the Covariance for this data set and see what it has to say about the relation between these two variables.
Here is the formula for it.
Cov(x,y) = Σ ((xi – x) * (yi - y) / N
The mean for max temperature works out to 24.6°C, and for the ice cream sales, it works out to 57.7 units.
Step 2: The next step is to pick each row of the data set and calculate the multiplication of their differences with respective means.
Say you pick Sunday, and the data is 23°C and 50 units. The calculation goes like this:
(23 - 24.6) * (50 - 57.7)
= 12.1
Step 3: Do this for all rows of the data set, and add up the results.
We get a total of 207.1
Step 4: In the last step, we divide the total by the number of rows of data we have.
That would be 207.1 / 7 = 29.59
That's our Covariance.
Now, how do we interpret this number? Covariance gives us an idea of the joint movement of the variables.
If Covariance is positive - we say the variables are moving together.
If Covariance is zero - we say the variables are independent of each other.
Covariance is negative - we say the variables are moving in opposite directions.
In our case, the number is positive, and we can conclude that the two are moving together.
Is there a problem here, though?
Yes. The Covariance does not offer much beyond telling us if a relationship exists between variables and in what direction. For example, what meaning do we extract from a Covariance figure of 0.0023 versus 23000? Not much.
This is where the Correlation Coefficient comes into play. Let's discuss it in the next section.