Standard Deviation
This can make you feel lazy!
The simplest explanation for standard deviation is that it is the square root of the variance. You would find that variance is too big for comparisons given the squaring involved in its calculation. While that part is inevitable to take care of the negative values and the extremes as discussed earlier, the square root of the same comes in quite handy and hence the use of standard deviation.
The standard deviation is denoted by the symbol sigma - σ
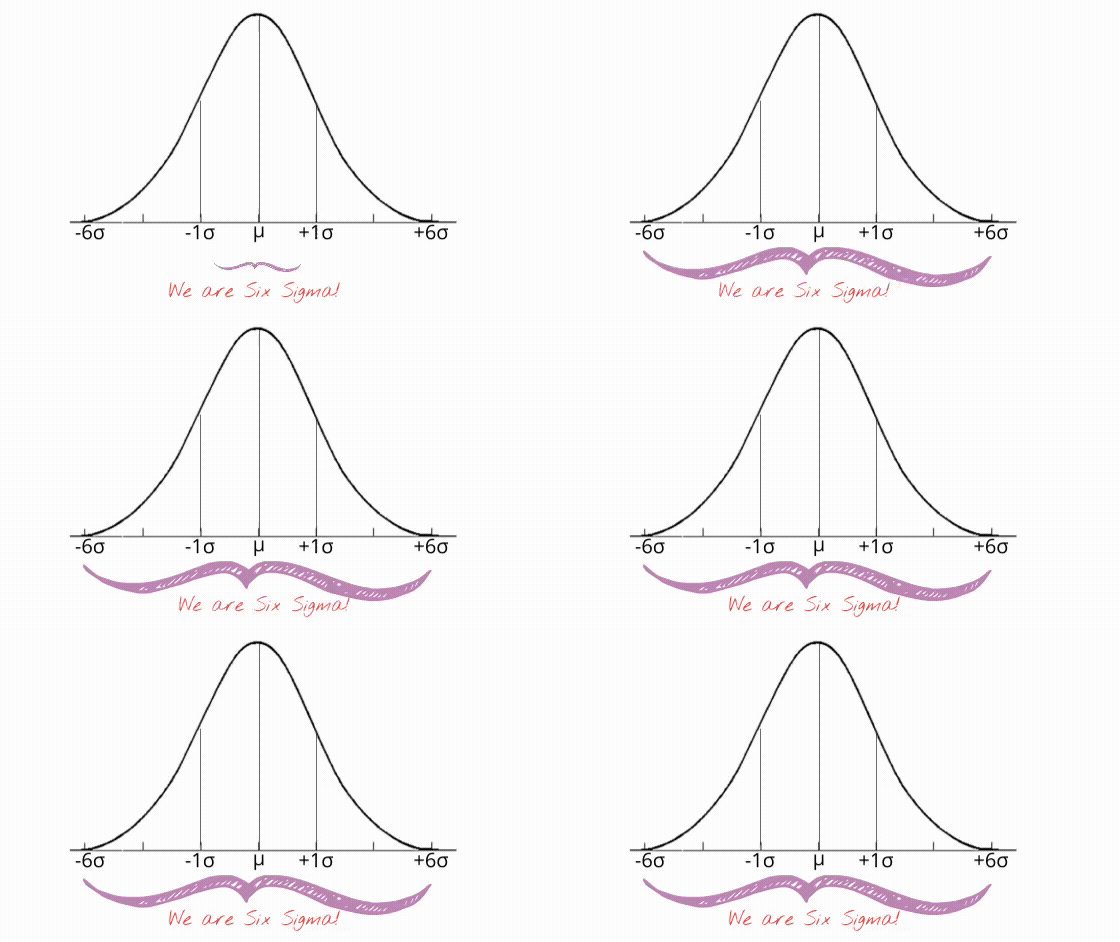
Ever heard the term Six Sigma? It gets its name from an interesting application of standard deviation.
See the image below.

The significance of standard deviation is that it conveys an expectation of where the data point should ideally be lying.
As an example, consider the manufacturing process of pens. You would want all the pens to be of equal length. In reality, though, they differ in size, even if it is hard to notice. As part of a quality control process, you work with control limts defined by your customer for accepting small variations in pen length. Similarly, you could have such limits for the thickness of the pen's nib, the diameter of the pen, well, you could go on.
Now, if you pick a random pen from the production and verify its dimensions - length, nib's thickness, diameter, etc., and either accept it based on the criteria or reject it. The pen you reject is called a defect, as it does not adhere to the criteria.
Such a production process is said to be at a level of Six Sigma if the number of defects in a million pens produced is under 3.4. Sounds impossible? No, it's difficult and requires continuous improvement of the processes, but it has been achieved by many, starting from the teams at Motorola.